|
|
DevelopmentSega Master System / Mark III / Game Gear |
Home - Forums - Games - Scans - Maps - Cheats - Credits |
YM 2413 Reverse Engineering Notes 2015 - 02 - 09
by andete. Original documents available at: https://github.com/andete/ym2413/tree/master/results
<< | YM2413 Reverse Engineering Notes | YM2413 Reverse Engineering Notes 2015-03-05 >>
[ This is very very much work in progress !!! The goal is to eventually have a document that describes the detailed workings of the YM2413 sound generation. And to a lesser degree the approach taken to discover this behavior. ATM I don't yet know much about the detailed behavior, so the only thing I can write about is the reverse engineering step. I expect this document will still heavily be rewritten. I also expect this document will contain many mistakes that (hopefully) will be corrected over time. ]
- - - - - - - - - - - - - - - - - - - - - - - - - - - - - - - - - - - - -
Reconstructing the YM2413 digital signal
YM2413 has two analog output pins for the audio signal (one for the music and one for the rhythm channels). From the YM2413 datasheet we can deduce that right before being converted to an analog signal, those audio signals are a 9-bit digital signals. If we want to reverse-engineer the (digital) algorithms the YM2413 uses internally, it would be very useful to be able to reconstruct those internal digital signals.
Test setup
[TODO] More detailed description of the test setup.
- test board containing:
- ARM micro controller
- YM2413
- signal shaping daughter board (TODO explain why needed?)
- connected to PC over USB (bidirectional communication)
- ARM can control YM2413 pins
- -> write register values
- -> also control clock input
- ==> combined gives exact control over when which registers are written
- ARM SoC has built-in ADC (12-bit) (enough to recover 9-bit signal?)
- MO and RO YM2413 pins are (via the signal shaping board) connected to the ADC
Sampling the YM2413 output
Very simple test program: writes the following YM2413 registers
- R#0x00 = 0x20
- R#0x01 = 0x20
- R#0x02 = 0x3F
- R#0x03 = 0x00
- R#0x04 = 0xFF
- R#0x05 = 0xFF
- R#0x06 = 0x0F
- R#0x07 = 0x0F
- R#0x10 = 0x61
- R#0x30 = 0x00
- R#0x20 = 0x12
This sets up a custom instrument that plays a sine wave (regs 0-7) and then plays this instrument on channel 0 with maximum volume. ARM samples the MO pin and sends data back to PC.
[TODO] Explain the time-multiplexing of signal on the MO/RO pin? Pattern repeats every 72 YM2413 clocks, we sample once every 72 clocks.
[TODO] Explain how to choose at which of the 72 clocks to sample?
[TODO] Show a picture of the actual (time-multiplexed) signal (from the oscilloscope)?

The above image shows (part of) the sampled signal. The horizontal axis shows the sample number, the vertical axis the corresponding ADC sample value (because the ADC has a 12 bit resolution, these values go from 0 to 4095). As you can see, we indeed get a sine wave.

If we zoom in, you can see there are discrete levels in the signal. These levels corresponds with a single YM2413 output value. Because we're playing a relatively low frequency note, the YM2413 output remains constant for several consecutive samples (not only near the top/bottom of the sine wave).
But you also see there is quite some noise on the signal. And occasionally the amplitude of the noise is bigger than half the distance between two YM2413 levels. Unfortunately this means that occasionally we will miss-classify some YM2413 sample values.
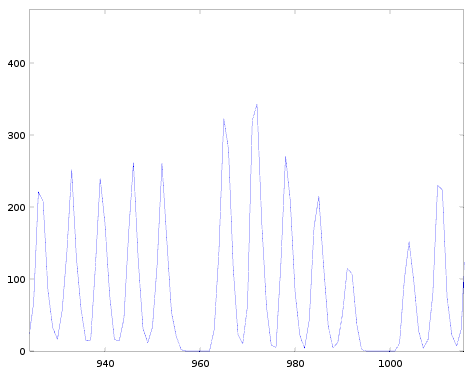
This image shows (a small part of) the histogram of the signal. So on the horizontal axis we have the value (0-4095) of the sampled signal. And on the vertical axis we count how many times we encountered that particular sample value in the full signal.
We clearly see distinct peaks in the histogram. These peaks correspond with the different YM2413 output levels. Ideally these peaks should be very tin, but because of noise they become broader. Between two peaks the histogram does not completely drop down to zero. This means that we also have samples that lie halfway between two YM2413 levels. It's not possible to know whether such halfway samples actually belong to the left or to the right peak.
Some of the peaks have a very sharp tip (e.g. the peaks around 950), other seem to be cut-off (e.g. the rightmost one around 1010). This is because the actual position of the peak is in-between two ADC sample values.
[TODO] explain voltage levels of YM2413 and ADC and how these levels cannot always match exactly
Another obvious feature in this histogram picture is that there seem to be two peaks missing. So the YM2413 is not using all 512 different possible output values (remember the YM2413 signal has a 9-bit resolution). Though this can easily be explained by assuming that internally the YM2413 uses a sine-table with only a limited resolution.
[TODO] Explain in more detail? Or in a later section?
These missing peaks are actually useful in this experiment. If you look at the full histogram (not shown) and look at the pattern of the missing peaks, you notice that it's symmetric around ADC sample 2048. This is indeed what you'd expect for a symmetric signal like a sine-wave.
[TODO] Explain why it's not a coincidence that the middle YM2413 value corresponds with the middle ADC value? -> Because we use the ADC in differential mode and we measure the difference between the RO and MO pin.
If we count the number of peaks in the full measured histogram we only get 399. If we also include the positions where we see a missing peak, we get 511. This means the YM2413 can output 511 distinct levels and not 512 as would be possible with 9 bits. So the YM2413 levels can go from -255..0..+255 (level -256 is missing). And that's actually logical for an audio signal.
Reconstructing YM2413 values from ADC values
Now that we've sampled the YM2413 signal (this gives values in the range 0..4095) we still need to map those samples back to the original YM2413 digital values (these are values in range -255..+255 or 0..510).
A very naive approach would be to say we have 4096 possible sample values for 512 possible YM2413 values, so we simply divide 4096/512 and thus have 512 bins of each 8 samples. From [signal.png] it's easy to see this isn't going to work because the YM2413 output range doesn't exactly span the full ADC range. Instead the lowest sampled value is about 390 and the highest about 3792.
1st attempt: linear mapping
In my first attempt I tried a linear mapping between the YM2413 values and the ADC sample values: ADC-sample = YM2413 * scale + offset;
The first peak is centered around 395, the last peak around 3787. We know we have 511 (not 512) different YM2413 values, so that means the average distance between the peaks is about 6.65 ADC-samples (note that this is a non-integer value).
We can do slightly better by also allowing the position of the peaks to be non-integer values. For this we use the following trick:

We take the (integer numbered) sample in the histogram with the highest (local) value, we also take the immediate left and right neighbour samples. Then we fit a parabola through these three points and calculate the position of the maxima of that parabola. (A more physically correct approach might be to fit a Gaussian curve, though that's more complex to calculate and, as we'll see below, it won't make much difference in the quality of the end result).
With this we can calculate the parameters for a linear mapping. I did that and checked how well it matched the measured data. Unfortunately it didn't match very well. It turns out there are some non-linearities in either the YM2413 output, the shaping logic or in the ADC. More on this in the next section.
2nd attempt: measure position of each peak
For my second attempt I wrote a program that estimates the position of every peak in the histogram (again using quadratic interpolation). I amended this with the positions of the missing peaks (I assumed they're exactly in the middle of their two neighbours). So this gives 511 (estimated) positions.

The above image shows this. The horizontal axis has the peak numbers (or the YM2413 values) and the vertical axis shows the estimated position of that peak as an ADC sample value.
At first sight this is a straight line. Though if you look closely you notice a slight bend in the lower part of the graph (put a ruler on the graph to see it). The following picture show this more clearly.

This graph shows the 1st-differential of the previous graph. In other words: the difference between two consecutive points, corresponding to the distance between two consecutive YM2413 levels.
We see two things:
- For low values the average distance between two peaks is lower than for high sample values. So something in the YM2413/shaping/ADC-chain is non-linear.
- The graph is quite noisy.
The noise can easily be explained: the positions of the peaks are only estimates because also the input data contains noise. Though based on the physics of this setup, we expect the distance between neighbouring peaks to vary much more smoothly. So let's try to exploit this.
I wrote an (iterative) routine that both:
- moves the position of a peak closer to the middle of it's two neighbours
- also keeps it anchored to the original estimated position.
Both goals contradict each other, but we can give different weights to these two goals and play with them till we get a satisfactory solution. This is shown in the next two graphs:


The first graph looks like a smoother version of the previous differential graph. The overall shape is still the same: the distance between lower YM2413 values is less than between the higher ones. There are a few anomalies around 256 and 430, I can't immediately explain those.
The second graph shows how much each peak has moved compared to the original estimate. Most peaks have remained very close to their original position, they moved less than 0.5 ADC sample values. And very few peaks moved up to 1.0 ADC value. These movements fall withing the error margin of the original estimates.
Generate look-up-table
Now that we have good estimates for the positions of the YM2413 values on the ADC scale, we can construct a lookup table. Each (integer) ADC value is simply associated with the YM2413 value that corresponds with the closest peak in the histogram.
I constructed this look-up-table (LUT) both for the smoothed and non-smoothed version of the peak estimates. It turns out that the smoothing has not that much effect. When comparing both occasionally there's a difference for ADC values that fall halfway between two peaks. In one version such a ADC value is assigned to the left peak while the other version assigns it to the right peak or vice versa. From manually (visually) inspecting the data it's not clear which assignment is better.
I also noticed that the positions of the peaks vary slightly when the board has been running for a long period of time. It's looks as-if the amplification factor of the signal-shaping-board varies slightly. Possibly this is temperature dependant?
Automatic calibration
Because of all the stuff above I think it's a good idea to (re-)calibrate the LUT before (and possibly between) the measurements. I'm almost at a point where I can fully automatically run this calibration step.
Next steps:
- reverse engineer the internal YM2413 tables
- log-sin table
- exponential table
- instrument ROM (very likely as the very last step)
- volume levels: (easy?) likely correspond to a fixed offset in the exp-table
- envelope shapes
- decay
- attack
- AM and PM stuff
<< | YM2413 Reverse Engineering Notes | YM2413 Reverse Engineering Notes 2015-03-05 >>
