|
|
DevelopmentSega Master System / Mark III / Game Gear |
Home - Forums - Games - Scans - Maps - Cheats - Credits |
YM 2413 Reverse Engineering Notes 2015 - 03 - 20
by andete. Original documents available at: https://github.com/andete/ym2413/tree/master/results
<< YM2413 Reverse Engineering Notes 2015-03-16 | YM2413 Reverse Engineering Notes | YM2413 Reverse Engineering Notes 2015-03-27 >>
In this post I'll look at the YM2413 envelope generator (EG). The EG has 4 phases: attack, decay, sustain and release (sometimes referred to as ADSR-envelopes). More specifically, in this post I'll look at the decay and release part. In fact release behaves the same as decay, so I'll only discuss decay. I'll leave the attack part for later because it's more difficult. The sustain part is trivial (envelope level remains constant) I won't discuss that either.
Envelope-Generator Decay-Rate levels
To start this experiment I manually tweaked the instrument/channel parameters till I got a 'nice' looking waveform (I'll explain in a bit what I mean with 'nice'). I came up with these settings:
| Operator | AM | PM | EG | KR | ML | KL | TL | WF | FB | AR | DR | SL | RR |
|---|---|---|---|---|---|---|---|---|---|---|---|---|---|
| modulator | 0 | 0 | 1 | 0 | 00 | 0 | 63 | 0 | 0 | 15 | 15 | 00 | 15 |
| carrier | 0 | 0 | 1 | 0 | 00 | 0 | 0 | 15 | 03 | 15 | 05 |
| reg#0x20 = 0x00 | key-off |
| reg#0x10 = 0x00 | fnum-low=0 |
| reg#0x30 = 0x00 | max volume / custom instrument |
| reg#0x20 = 0x19 | key-on / block=4 / fnum=256 |
Note that the 'key-on' bit is first set to 0 then to 1, this makes sure we re-trigger the ADSR phases.
These settings result in the following waveform:

As expected the envelope of the wave goes down exponentially. When plotted in a logarithmic scale (not shown) it goes down linearly, and as we'll see that's also how the YM2413 implements the envelopes.
If we zoom-in at the top region (the rectangle marked in green), we see this:
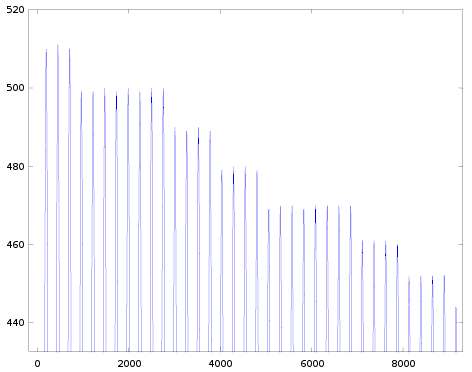
We want to measure the EG levels (y-axis), though the YM2413 output level not only depends on the EG but also on the volume (no problem we picked the maximum volume) and the sine-wave-phase. So for each EG level we want to make sure the sine-wave-table hits a value (close to) the maximal value.
So a 'nice' signal means:
- Pick the frequency 'just right':
- too low -> sine doesn't reach max amplitude in each EG segment
- too high -> step-size may be too high so that we skip over the max amplitude region in the sine-table
- Pick decay rate (DR) 'just right':
- too high -> we skip over the maximum amplitude
- too low -> not really a problem, but measurements takes very long
In the zoomed image you see that for each EG segment we have at least 4 peaks where the sine wave reaches max amplitude. 1 peak might also work, but 4 allows to double check (in case of noise).
Note that we picked SL=15 (the maximum value). This means the EG will only go down to -45dB. This is not the full YM2413 range which is -48dB.
The next two images zoom-in near the tail of the waveform (the rectangle marked in red in the full image):


The first of these two shows the location where signal just goes to lowest amplitude, after this point it only takes on the values +1, +0, -0, -1 anymore. The second images is located much further to the end where the envelope has stabilized (so where we reached -45dB). It uses the same 4 output levels. But if you look closely the shape is not the same (in an earlier post we had a similar situation for volume=14 vs volume=15). Unfortunately this means that figuring out the number of EG steps is not as simple as counting the number of plateaus in the waveform.
To investigate this further I wrote a program that takes the waveform as input and:
- Detects changes in the EG level (to do this is looks for local maxima, then it looks for (abrupt) changes in successive maxima).
- It prints both the amplitude and the position of these changes. (Note that amplitudes are in DAC values instead of converting them to YM2413 values, I found this to be more robust against measurement noise).
- It also prints the difference in position compared to the previous change.
The result is shown in the following table:
| x | y | delta-x | |
|---|---|---|---|
| 0 | 60494 | - | |
| 1020 | 59313 | 1020 | |
| 3068 | 58240 | 2048 | |
| 4092 | 57162 | 1024 | |
| 5116 | 56084 | 1024 | |
| 7164 | 55111 | 2048 | |
| 8188 | 54146 | 1024 | |
| 9212 | 53265 | 1024 | |
| 11260 | 52358 | 2048 | |
| 12284 | 51469 | 1024 | |
| 13308 | 50706 | 1024 | |
| 15356 | 49962 | 2048 | |
| 16380 | 49204 | 1024 | |
| 17404 | 48531 | 1024 | |
| 19452 | 47865 | 2048 | |
| 20476 | 47221 | 1024 | |
| 21500 | 46565 | 1024 | |
| 23548 | 46032 | 2048 | |
| 24572 | 45489 | 1024 | |
| 25596 | 44941 | 1024 | |
| 27644 | 44394 | 2048 | |
| 28668 | 43855 | 1024 | |
| 29692 | 43421 | 1024 | |
| 31740 | 42983 | 2048 | |
| 32764 | 42547 | 1024 | |
| 33788 | 42124 | 1024 | |
| 35836 | 41677 | 2048 | |
| 36860 | 41356 | 1024 | |
| 37884 | 40920 | 1024 | |
| 39932 | 40592 | 2048 | |
| 40956 | 40271 | 1024 | |
| 41980 | 39949 | 1024 | |
| 44028 | 39623 | 2048 | |
| 45052 | 39407 | 1024 | |
| 46076 | 39081 | 1024 | |
| 48124 | 38856 | 2048 | |
| 49148 | 38536 | 1024 | |
| 50172 | 38318 | 1024 | |
| 52220 | 38100 | 2048 | |
| 53244 | 37883 | 1024 | |
| 54268 | 37667 | 1024 | |
| 56316 | 37444 | 2048 | |
| 57340 | 37232 | 1024 | |
| 58364 | 37012 | 1024 | |
| 60412 | 36797 | 2048 | |
| 61436 | 36688 | 1024 | |
| 62460 | 36471 | 1024 | |
| 64508 | 36359 | 2048 | |
| 65532 | 36144 | 1024 | |
| 66556 | 36036 | 1024 | |
| 68604 | 35929 | 2048 | |
| 69628 | 35812 | 1024 | |
| 70652 | 35604 | 1024 | |
| 72700 | 35491 | 2048 | |
| 73724 | 35386 | 1024 | |
| 74748 | 35279 | 1024 | |
| 76796 | 35173 | 2048 | |
| 77820 | 35066 | 1024 | |
| 78844 | 34957 | 1024 | |
| 80892 | 34849 | 2048 | |
| 81916 | 34732 | 1024 | |
| 84988 | 34624 | 3072 | <-- no longer follows pattern |
| 86012 | 34516 | 1024 | |
| 87036 | 34407 | 1024 | |
| 90108 | 34300 | 3072 | |
| 93180 | 34189 | 3072 | |
| 94204 | 34081 | 1024 | |
| 97276 | 33971 | 3072 | |
| 99324 | 33861 | 2048 | |
| 102396 | 33751 | 3072 | |
| 106492 | 33646 | 4096 | |
| 109564 | 33537 | 3072 | |
| 114684 | 33422 | 5120 | |
| 118780 | 33317 | 4096 | |
| 123900 | 33206 | 5120 | |
| 131068 | 33099 | 7168 | |
| 140284 | 32990 | 9216 | |
| 152572 | 32877 | 12288 |
The upper part of this table is very regular, delta-x always repeats the same pattern: 1024 1024 2048 (this pattern will be explained in the second part of this post).
Starting from x=84988 the pattern breaks. Though at that point, when translated to YM2413 output levels, the difference in amplitude is only 1 level. So there simply cannot be a level in between. Or at least my program cannot detect such 'in between' levels. When visually inspecting the waveform around x=83964 I indeed saw a change in waveform 'shape' (I've not created a picture of it, but it's similar to the two pictures of the tail above). So it's reasonable to assume that the pattern '1024 1024 2048' simply keeps on repeating till the end.
The changes in waveform-shape are very subtle, but as far as I can tell the waveform really stops changing at (about) x=162474. That corresponds to 120 different EG levels (and confirmed by following the '1024 1024 2048' pattern). Remember that we set car.SL=15 (means decay from 0dB to -45dB). If we extrapolate to the full range (0dB to -48dB) there would be 128 EG steps, and that's a nice 'round' number.
The YM2413 datasheet mentions EG goes in steps of 0.325dB. Instead we measured 48dB/128 = 0.375dB. So I assume the value in the datasheet is a typo (as we'll see below there are more such typos in the datasheet).
Envelope-Generator Decay-Rate timing
To reverse engineer the decay-rate timing I took a different approach: I started from the decay-rate timing table (0%-100%) in the YM2413 datasheet. (I actually did a large part of this analysis before I had access to the YM2413 measurement board).
I've copy/pasted the table from the datasheet below, but reformatted it in 4 columns (so e.g. RATE=25 can be found in row '24' column '+1').
| RATE | +0 | +1 | +2 | +3 |
|---|---|---|---|---|
| 0 | inf | inf | inf | inf |
| 4 | 20926.6 | 16807.2 | 14006 | 12028.7 |
| 8 | 10463.3 | 8403.58 | 7002.98 | 6014.32 |
| 12 | 5231.64 | 4201.79 | 3501.49 | 3007.16 |
| 16 | 2615.82 | 2100.89 | 1750.75 | 1503.58 |
| 20 | 1307.91 | 1050.45 | 875.37 | 751.79 |
| 24 | 653.95 | 525.22 | 437.69 | 375.9 |
| 28 | 326.98 | 262.61 | 218.84 | 187.95 |
| 32 | 163.49 | 131.31 | 109.42 | 93.97 |
| 36 | 81.74 | 65.65 | 54.71 | 46.99 |
| 40 | 40.87 | 32.83 | 27.36 | 23.49 |
| 44 | 20.44 | 16.41 | 13.68 | 11.75 |
| 48 | 10.22 | 8.21 | 6.84 | 5.87 |
| 52 | 5.11 | 4.1 | 3.42 | 2.94 |
| 56 | 2.55 | 2.05 | 1.71 | 1.47 |
| 60 | 1.27 | 1.27 | 1.27 | 1.27 |
The first and last rows are special (rate 0..3 show no decay, rates 60..63 have the same value). The other rows have the following structure:
- The values in row N+1 are equal to the values in row N divided by 2.
- The values in column +1 are approx equal to column +0 times 4/5 [1].
- The values in column +2 are approx equal to column +0 times 4/6.
- The values in column +3 are approx equal to column +0 times 4/7.
The values in the table are listed in milliseconds. When expressed in multiples of the YM2413 sample duration (sample-rate = 3579545MHz/72) it shows even more structure. I won't show such a transformed table. Instead I'll give a program that can reconstruct the original table.
for (int i = 4; i < 64; ++i) {
int s[4] = {127, 102, 85, 73};
int cycles = (i < 60)
? (1 << (14 - (i / 4))) * s[i & 3]
: 63;
cout << cycles * dur << endl;
}
And the corresponding generated table:
| RATE | +0 | +1 | +2 | +3 |
|---|---|---|---|---|
| 0 | inf | inf | inf | inf |
| 4 | 20926.6 | 16807.2 | 14006.0 | 12028.7 |
| 8 | 10463.3 | 8403.59 | 7002.99 | 6014.33 |
| 12 | 5231.65 | 4201.79 | 3501.49 | 3007.17 |
| 16 | 2615.82 | 2100.90 | 1750.75 | 1503.58 |
| 20 | 1307.91 | 1050.45 | 875.374 | 751.792 |
| 24 | 653.956 | 525.224 | 437.687 | 375.896 |
| 28 | 326.978 | 262.612 | 218.843 | 187.948 |
| 32 | 163.489 | 131.306 | 109.422 | 93.9739 |
| 36 | 81.7445 | 65.653 | 54.7109 | 46.9870 |
| 40 | 40.8722 | 32.8265 | 27.3554 | 23.4935 |
| 44 | 20.4361 | 16.4133 | 13.6777 | 11.7467 |
| 48 | 10.2181 | 8.20663 | 6.83886 | 5.87337 |
| 52 | 5.10903 | 4.10331 | 3.41943 | 2.93669 |
| 56 | 2.55451 | 2.05166 | 1.70971 | 1.46834 |
| 60 | 1.26720 | 1.26720 | 1.26720 | 1.26720 |
By properly rounding these values we can almost perfectly reproduce the values from the datasheet. (Initially there were some discrepancies, but these all turned out to be transcription errors from a not always very readable scanned document, so single-digit errors like 0<->8 or 2<->7).
So now we have a formula for the decay rate timing. But what do these numbers mean exactly? How can we translate these numbers to changes in the envelope level?
From the previous section we know there are 128 envelope levels. So in a way the only remaining question we need to answer is: When does the envelope generator switch from one level to the next?
I didn't figure this out completely myself, instead I read existing OPLx emulation code (mostly YM2413Burczynski.cc and YMF262.cc in the openMSX source tree). Based on that I got a good idea of what to look for and then I could confirm (or reject, see below) whether the measurements matched the emulation algorithm.
So at each sample for each operator we need to decide whether to go to the next envelope level or not. The algorithm goes like this:
- Depending on the {mod,car},{DR,RR,KSR} and channel.{fnum,block} settings we calculate an effective-rate (the formula is given in the datasheet). This results in a number between 0 and 63 (this is also the index in the decay-rate tables above).
- Rates 0..3 and 60..63 are special:
- For the other levels we calculate 2 parameters (parameter names taken from the YM2413Burczynski source code):
- 'eg_select' selects between 4 small tables (with each 8 entries):
- There is one global counter (shared among the 18 operators), each sample that counter is increased by one. (Side-note: the same counter is also used for other stuff, hopefully I can confirm that in future posts).
- For each operator we shift that global counter right over 'eg_shift' bits. Only if all the bits that were shifted out are zero we execute the next step. (Side-note: an alternative mechanism that may or may not be cheaper in hardware is to look at the carry-in bits from incrementing the global counter, or check whether the n-th bit changed after the increment). So for example if 'eg_shift=4', we only execute the next step once in every 1<<4 = 16 iterations.
- We take the lower 3 bits of the shifted global counter and use that as an index in the 'eg_select' table. Then add the value from the table to the current EG level. Note that the table may contain 0 (so we still don't advance in that case).
An example: for RATE=8, in this step, we only go 4 out of 8 times to the next level. For rates 9, 10 and 11 that's respectively 5/8, 6/8 and 7/8. If we follow this sequence we'd expect 8 out of 8 for RATE=12, instead we again use the 4/8-table. But because eg_shift is one less for RATE=12 compared to RATE=8 this step triggers twice as often and we effectively get 8/8.
Another example: the waveform shown in the pictures above has decay RATE=14. For that rate we have eg_shift=10 and use the table {0,1,1,1,0,1,1,1}. eg_shift=10 means we only advance every 1024 samples. The table means we only advance 3 out 4 times (=6/8). So combined this means that the number of samples before moving to the next EG level is in sequence 2048, 1024 and 1024 samples. And this is exactly what we measured.
Note that because of the global counter, the transition from the very first EG level (level 0) to the next level typically triggers faster than the transitions to the other levels (because the global counter is likely not zero when the decay phase starts). I didn't mention it before, but in the zoomed image above you can indeed see that the first EG-segment only has 3 peaks while all the others have 4 or 8 peaks.
Side-note: one difference between the YM2413Burczynski code and the measurements is that the former uses 256 EG levels while we only measured 128 levels. This mistake might be because the YM2413Burczynski code is derived from OPL2/3 emulation code and those chips have double the EG resolution (0.1875dB per step, in addition the OPL2/3 EG range is 0-96dB, so in total OPL2/3 have 512 EG-steps).
Next to rate=14 (see the images above), I also confirmed the following rates using the same approach, I only had to re-tweak the parameters to again get a 'nice' waveform:
For the following rates I had to use a different approach. I'll first show the results:
The envelope is changing very rapidly (only stays constant for 4 or 2 samples), so the sine-wave-peaks approach doesn't work anymore. Instead I generated a waveform like this (image shows rate=49):

Instead of having an infinitely fast attack rate (AR=15) I used a slower one (AR=4..7). The left part of the image shows the attack phase, the right part shows the decay phase. I also used a very low frequency (though I could only use 'fnum' for this, 'block' has an influence on the effective-rate so it cannot be chosen freely). The combination of AR and fnum is chosen so that when the attack phase finishes we're (approximately) at 1/4th of the sine wave. So at that point we've reached the 'top' of the sine and that means locally the sine wave is not changing too much. At least the sine-shape is changing much less compared to the rapid decay-rate changes. This can be seen in the red-encircled part in the image: at the end of the attack-phase, the waveform is reasonably flat, at least compared to the decay phase immediately right of it.
The next image shows the same waveform, but zoomed-in on the decay phase (the green rectangle in the picture above).

You clearly see (short) flat sections in this picture (this means that indeed the sine-shape isn't changing too much yet). You can see that there's a repeating pattern of 3 segments of length 4 followed by 2 segments of length 2. And that's exactly what the above algorithm predicts.
I measured rates 52..59 in a very similar way but now it did NOT fully match the predictions. The overall duration was predicted correctly, but not the details of the EG-level-transitions. I'll again first show the results:
Note: segment duration of 0.5 means EG advanced 2 steps
Because this is such an unexpected result I'm including a picture of rate=54, so you can double check my findings:

This is again zoomed-in at the decay phase. It shows 2 segments of length 2 followed by 4 segments of length 1. To me this is very unexpected because the original algorithm predicts only 1 segment of length 2 followed by 2 segments of length 1, and that would result in a much smoother curve.
For rates 52..55 the above algorithm would work and would give a smoother result. For rates 56..59 the algorithm breaks down, because eg_shift is negative. The YM2413Burczynski code has a solution for that, but I didn't bother explaining it because the predictions are anyway wrong.
The above algorithm can be fixed by changing to 16-entry eg_select tables for rates 52..59:
These tables show what is happening, but it almost certainly is not how it is happening. I mean how it is implemented it hardware (though for a software implementation it might be the simplest approach). If it really was based on 16-entry tables then for sure the curves could be made smoother.
Die-shot
I again looked at the YM2413[2] die-shot: http://siliconpr0n.org/map/yamaha/fhb013/mz_ns50xu/ And I'm glad that also this time I found a feature that supports the findings in this post:

Use the die-shot link to zoom-in on the region marked in red in this (small) picture. You'll find an array of 7 chains of 18 flip-flops. That is 18 times a 7-bit value. Or for each of the 18 operators a 7-bit EG-level value. The output of those flip-flop-chains also seems to be routed to some small logic block (an adder?) and then further routed to the input of the exp-table-ROM. That's exactly what you'd expect for the EG-level values.
The die-shot also, more or less, confirms the global shared counter approach. At least we do not see any array of 18x(13+3) bits, such an array would be required to give each operator it's own counter.
There is a yet-unknown array of 18x12 bits (located in the top-middle rectangle). My current best *guess* is that this is related to the phase-modulation calculations. At least the YM2413 emulators seem to require extra storage for this (carried from one iteration to the next). Hopefully I can tell more about this in the future.
- ^ More accurate values for the column-ratios are: 102/127, 85/127, 73/127. Side-note + looking ahead: these less nice ratios are because the table lists the time needed for 127 EG transitions, if they were based on 128 transitions (so if the duration of the first or last level was included, then the simpler ratios would be correct).
- ^ actually the fhb013
<< YM2413 Reverse Engineering Notes 2015-03-16 | YM2413 Reverse Engineering Notes | YM2413 Reverse Engineering Notes 2015-03-27 >>
