|
|
DevelopmentSega Master System / Mark III / Game Gear |
Home - Forums - Games - Scans - Maps - Cheats - Credits |
YM 2413 Reverse Engineering Notes 2015 - 03 - 27
by andete. Original documents available at: https://github.com/andete/ym2413/tree/master/results
<< YM2413 Reverse Engineering Notes 2015-03-20 | YM2413 Reverse Engineering Notes | YM2413 Reverse Engineering Notes 2015-04-09 >>
Last post we looked at the YM2413 decay rates. Now it's time for the attack rates. Unfortunately I wasn't yet able to figure it out completely. But I'll already post what I've got now. Maybe one of you can help fill in some details.
Attack-rate table from the YM2413 datasheet
Let's start with the 0%-100% attack-rate table from the YM2413 datasheet. The first table below is copy/pasted from the datasheet (but rearranged in 4 columns). The second table is calculated using the C-program listed below.
| RATE | +0 | +1 | +2 | +3 |
|---|---|---|---|---|
| 0 | inf | inf | inf | inf |
| 4 | 1730.15 | 1400.60 | 1153.43 | 988.66 |
| 8 | 865.08 | 700.30 | 576.72 | 494.33 |
| 12 | 432.54 | 350.15 | 288.36 | 247.16 |
| 16 | 216.27 | 175.07 | 144.18 | 123.58 |
| 20 | 108.13 | 87.54 | 72.09 | 61.79 |
| 24 | 54.07 | 43.77 | 36.04 | 30.90 |
| 28 | 27.03 | 21.88 | 18.02 | 15.45 |
| 32 | 13.52 | 10.94 | 9.01 | 7.72 |
| 36 | 6.76 | 5.47 | 4.51 | 3.86 |
| 40 | 3.38 | 2.74 | 2.25 | 1.93 |
| 44 | 1.69 | 1.37 | 1.13 | 0.97 |
| 48 | 0.84 | 0.70 | 0.60 | 0.54 |
| 52 | 0.50 | 0.42 | 0.34 | 0.30 |
| 56 | 0.28 | 0.22 | 0.18 | 0.14 |
| 60 | 0.00 | 0.00 | 0.00 | 0.00 |
| RATE | +0 | +1 | +2 | +3 |
|---|---|---|---|---|
| 0 | inf | inf | inf | inf |
| 4 | 1730.15 | 1400.6 | 1153.43 | 988.657 |
| 8 | 865.075 | 700.299 | 576.717 | 494.329 |
| 12 | 432.538 | 350.15 | 288.358 | 247.164 |
| 16 | 216.269 | 175.075 | 144.179 | 123.582 |
| 20 | 108.134 | 87.5374 | 72.0896 | 61.7911 |
| 24 | 54.0672 | 43.7687 | 36.0448 | 30.8955 |
| 28 | 27.0336 | 21.8843 | 18.0224 | 15.4478 |
| 32 | 13.5168 | 10.9422 | 9.0112 | 7.72389 |
| 36 | 6.7584 | 5.47109 | 4.5056 | 3.86194 |
| 40 | 3.3792 | 2.73554 | 2.2528 | 1.93097 |
| 44 | 1.6896 | 1.36777 | 1.1264 | 0.965486 |
| 48 | 0.8448 | 0.683886 | 0.5632 | 0.482743 |
| 52 | 0.4224 | 0.341943 | 0.2816 | 0.241371 |
| 56 | 0.201143 | 0.160914 | 0.1408 | 0.120686 |
| 60 | 0 | 0 | 0 | 0 |
for (int i = 4; i < 60; ++i) {
int s[4] = {21, 17, 14, 12};
int cycles = (i < 56)
? (1 << (13 - (i / 4))) * s[i & 3]
: s[i & 3] / 2;
cout << cycles * dur << endl;
}
Attack rates 0..3 take infinitely long (envelope doesn't change). Rates 60..63 are instantaneous.
Similar to the decay-rate tables, each row is half the row above, and there's also a fixed ratio between the values in the columns (factors are "21 17 14 12"). Though for the higher rates (48 and above) this isn't 100% correct anymore.
When expressed in YM2413 samples (49716Hz) instead of milliseconds, and rounded to the nearest integer, the values listed in the datasheet match exactly with the predicted values. At least up-to rate=48, for higher rates the values start to deviate.
Though it's not clear what the predictions in the above table actually mean. E.g. where do these column-ratios "21 17 14 12" come from? And how does the envelope actually change over that time period?
Attack rate measurements
Let's first look at some pictures:
| +0 | +1 | +2 | +3 | ||
|---|---|---|---|---|---|
| 4 |  |  |  |  | |
| 8 |  |  |  |  | |
| 12 |  |  |  |  | |
| 16 | 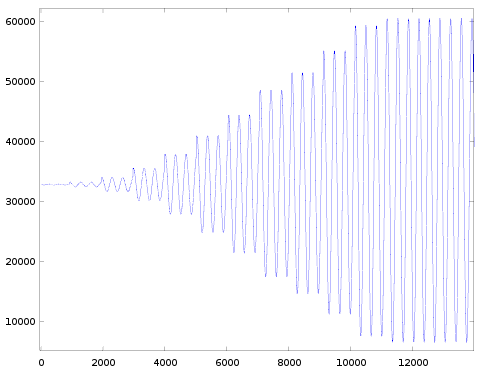 |  |  |  | |
| 20 |  |  |  |  | |
| 24 |  |  |  | 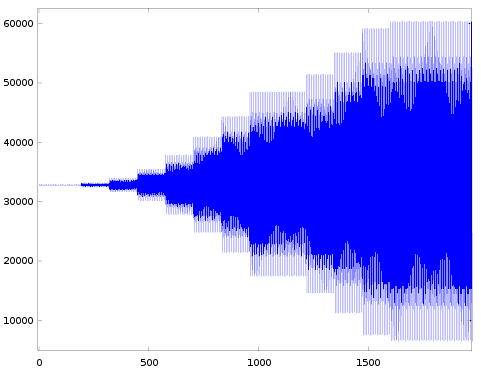 | |
| 28 |  | 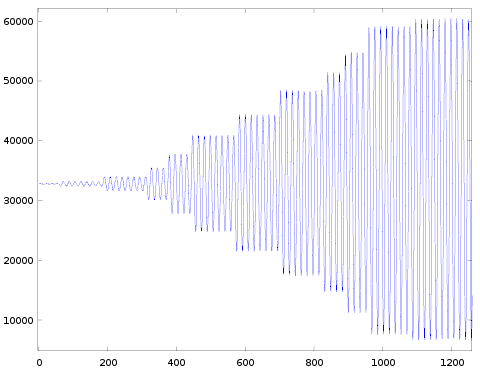 |  |  | |
| 32 |  |  |  |  | |
| 36 |  |  |  | 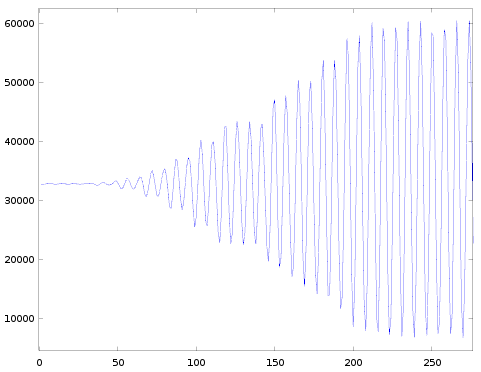 | |
| 40 | 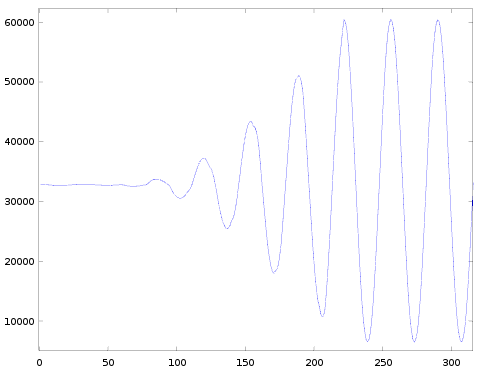 | 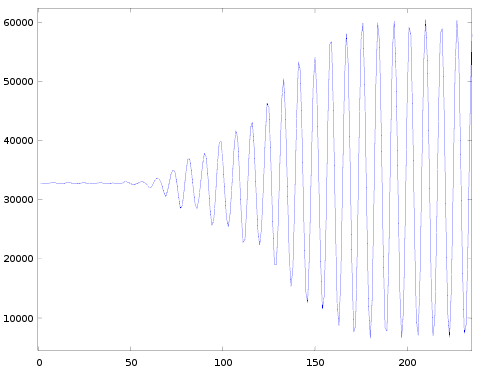 |  |  | |
| 44 |  |  |  |  |
These measurements are similar to the ones in the previous post: I played a sine wave but now varied channel.block and car.AR (instead of car.DR) to measure the different attack-rates (remember the effective rate is a combination of the selected AR parameter and the frequency of the channel). Here are the details of the settings I've used:
| Operator | AM | PM | EG | KR | ML | KL | TL | WF | FB | AR | DR | SL | RR |
|---|---|---|---|---|---|---|---|---|---|---|---|---|---|
| modulator | 0 | 0 | 1 | 0 | 00 | 0 | 63 | 0 | 0 | 15 | 15 | 00 | 15 |
| carrier | 0 | 0 | 1 | 0 | ** | 0 | 0 | ** | 00 | 15 | 15 |
| reg#0x20 = 0x00 | key-off |
| reg#0x10 = 0x** | fnum-low |
| reg#0x30 = 0x00 | max volume / custom instrument |
| reg#0x20 = 0x1* | key-on / block=* / fnum=* |
I varied car.AR from 0 to 15 and block between 1, 3, 5 and 7 (this gives effective rates 0..63). I mostly used fnum=256, but near the end I switched to fnum=511. I started with car.ML=0, but gradually ramped it up to car.ML=15.
Some observations:
- The general shape of all the graphs is roughly the same.
- The amplitude ramps up in discrete levels.
- The very first level often has a shorter duration than the others. We saw the same in case of decay, and it could be explained by assuming a global counter.
- When going from one row to the next, the timescale on the horizontal axis halves (explained by decreasing the 'eg_shift' factor).
- When going from one column to the next the detailed shape varies:
- There always seem to be 12 levels to go from lowest to highest amplitude. (In case of decay there were 128 levels).
- These 12 levels always seem to be the same in all the pictures (except for rate=4, I'll come back to this later).
- For the lower rates the pictures are pretty clear, though starting from rate=36 it gets harder and harder to see distinct levels in the attack envelope. And the pictures in the last row of this table are almost useless. That means we don't have good data for rates 44-59. In the previous post we learned that decay rates 52-59 behaved slightly different than rates 4..51, likely the same is true for the attack rates, but we don't have data to confirm it. I'll have to come up with a alternative way of measuring, more on this below.
- The pictures for column +2 could likely be improved by choosing a different frequency, though because it won't learn us anything new I didn't bother redoing the measurements.
Attack timing
Justified by the above measurements/observations we can now use almost exactly the same algorithm as we used for decay to explain the attack rate timing:
- Effective-rates 0..3 and 60..63 are special:
- For the other rates we calculate 2 parameters
- 'eg_select' selects between 4 small tables (with each 8 entries):
- There's a global counter, only when the value 'counter >> eg_shift' changes after the counter increased execute the next step.
- The 3 lower bits of the shifted counter pick an entry from the selected table. If that entry is '1' advance to the next attack level.
As mentioned above this algorithm likely doesn't apply for rates 52..59. It probably needs similar changes as were done for the decay-rate, though I don't have data yet to verify this.
To obtain data for these very high rates we cannot use the same measurement methodology (look at amplitude peaks). Instead I'm thinking about numerically matching all the sampled values with predictions from an emulation model. Though for this to work we first need to figure out the exact content of the internal sine and exponential table. That's something I'd like to do in one of the following posts.
Attack levels
We now know the timing of the attack-envelope transitions, but we do not yet know to what level we must go at each transition. (In case of decay it was simple: always add 1 (or 2) to the 7-bit EG counter).
In the above table we saw that (almost) all graphs used the same 12 amplitude levels. If we match those with levels of the decay envelope we get this:
| attack-step | amplitude | EG-level |
|---|---|---|
| 1 | 1 | 112-127 |
| 2 | 4 | 91-95 |
| 3 | 11 | 71-72 |
| 4 | 25 | 53 |
| 5 | 47 | 39 |
| 6 | 75 | 28 |
| 7 | 107 | 20 |
| 8 | 145 | 13 |
| 9 | 172 | 9 |
| 10 | 205 | 5 |
| 11 | 244 | 1 |
| 12 | 255 | 0 |
So for each of the 12 attack-rate levels (1st column) I measured the amplitude of the peaks (2nd column). Then I looked up the corresponding decay-EG level with the same amplitude (3rd column). Note that for low amplitudes there are multiple EG-levels that correspond with the same amplitude. So for the first few attack-steps I could only match a range of possible levels (I hope to also refine this measurement in the future).
I couldn't see any pattern in this sequence (3rd column), so I looked at earlier OPL3 reverse engineering work by 'carbon14' and 'opl3' for inspiration: http://forums.submarine.org.uk/phpBB/viewtopic.php?f=9&t=16
OPL3 has 512 EG steps (instead of 128 for YM2413). The formula for the OPL3 attack envelope levels is:
I tried to modify this for YM2413. The following comes close, but doesn't match exactly:
| predicted: | 127 | 95 | 71 | 53 | 39 | 29 | 21 | 15 | 11 | 8 | 5 | 3 | 2 | 1 | 0 |
| actual: | (127) | (95) | (71) | 53 | 39 | 28 | 20 | 13 | 9 | 5 | 1 | 0 |
So initially it matches pretty well, but near the end it goes too slow. I haven't been able yet to find a better formula.
Above I mentioned that 'almost' all rates used these same 12 levels. But rate=4 is different (visible in the pictures if you look closely). Instead for rate=4 I got this sequence:
So also 12 steps, but slightly different levels.
But when I repeated the measurement for rate=4 I got the same sequence as for all the other measurements. So likely there's nothing special about rate=4. The special thing is that it's the very first measurement I took.
When I start another measurement, I do not fully restart the YM2413 hardware, instead I briefly set the channel to key-off and then to key-on again. Because car.DR=0 and car.RR=15 this very quickly goes from EG-level=0 to EG=127 before starting the attack-phase. I don't remember what I was doing before the very first attack-measurement but possibly the EG-level was in a different state at that time.
So next I started experimenting with different settings for car.SL, car.DR, car.RR, ... I tried to get into a different EG-level before starting the attack-measurement. Only very occasionally I could trigger an alternative attack sequence. (Only) once I could reproduce the sequence
A few more times I got
But, by far, in the majority of the cases I got
I'm not sure yet what determines which sequence the attack-envelope follows. My best guess is that for some reason the initial EG level is not 127 but another value, and because of this the formula generates a different sequence. But I don't know yet why the initial value is different and I also don't know yet what the exact formula is that generates the sequence.
In this and in the previous post we've looked at the attack and decay (and release) states in isolation. We should still investigate in more detail what happens on the transition between the different states. But that's also something for later.
Next post
Above I already mentioned possible improvements to the attack-rate measurements: instead of looking for peak-amplitude, try to numerically match the measured values with predicted values. This will allow to also measure rates 44..59 and distinguish between levels with the same amplitude.
I also mentioned that to be able to construct an emulation model to make predictions we first need to know the content of the internal sine and exponential tables. My plan is to investigate that in one of the next posts.
However I can already give a program that correctly predicts the maximum amplitudes for all 128 EG levels. This program is based on earlier OPL3 reverse engineering work done by Matthew Gambrell and Olli Niemitalo: https://docs.google.com/document/d/18IGx18NQY_Q1PJVZ-bHywao9bhsDoAqoIn1rIm42nwo
I'll explain in more detail in a later post.
This is the program:
int lookupExp(int val)
{
return (expTable[val & 0xFF] << 1) >> (val >> 8);
}
int main()
{
for (int i = 0; i < 256; ++i) {
expTable[i ^ 255] = round(pow(2.0, i / 256.0) * 1024.0);
}
for (int i = 0; i < 128; ++i) {
cout << i << 't' << lookupExp(16 * i) / 16 << endl;
}
}
And below is the output it produces. This matches 100% with the measured amplitude of all 128 EG levels, including the same level-ranges that share the same maximum amplitude.
| EG-level | max-amplitude |
|---|---|
| 0 | 255 |
| 1 | 244 |
| 2 | 234 |
| 3 | 224 |
| 4 | 214 |
| 5 | 205 |
| 6 | 196 |
| 7 | 188 |
| 8 | 180 |
| 9 | 172 |
| 10 | 165 |
| 11 | 158 |
| 12 | 151 |
| 13 | 145 |
| 14 | 139 |
| 15 | 133 |
| 16 | 127 |
| 17 | 122 |
| 18 | 117 |
| 19 | 112 |
| 20 | 107 |
| 21 | 102 |
| 22 | 98 |
| 23 | 94 |
| 24 | 90 |
| 25 | 86 |
| 26 | 82 |
| 27 | 79 |
| 28 | 75 |
| 29 | 72 |
| 30 | 69 |
| 31 | 66 |
| 32 | 63 |
| 33 | 61 |
| 34 | 58 |
| 35 | 56 |
| 36 | 53 |
| 37 | 51 |
| 38 | 49 |
| 39 | 47 |
| 40 | 45 |
| 41 | 43 |
| 42 | 41 |
| 43 | 39 |
| 44 | 37 |
| 45 | 36 |
| 46 | 34 |
| 47 | 33 |
| 48 | 31 |
| 49 | 30 |
| 50 | 29 |
| 51 | 28 |
| 52 | 26 |
| 53 | 25 |
| 54 | 24 |
| 55 | 23 |
| 56 | 22 |
| 57 | 21 |
| 58 | 20 |
| 59 | 19 |
| 60 | 18 |
| 61 | 18 |
| 62 | 17 |
| 63 | 16 |
| 64 | 15 |
| 65 | 15 |
| 66 | 14 |
| 67 | 14 |
| 68 | 13 |
| 69 | 12 |
| 70 | 12 |
| 71 | 11 |
| 72 | 11 |
| 73 | 10 |
| 74 | 10 |
| 75 | 9 |
| 76 | 9 |
| 77 | 9 |
| 78 | 8 |
| 79 | 8 |
| 80 | 7 |
| 81 | 7 |
| 82 | 7 |
| 83 | 7 |
| 84 | 6 |
| 85 | 6 |
| 86 | 6 |
| 87 | 5 |
| 88 | 5 |
| 89 | 5 |
| 90 | 5 |
| 91 | 4 |
| 92 | 4 |
| 93 | 4 |
| 94 | 4 |
| 95 | 4 |
| 96 | 3 |
| 97 | 3 |
| 98 | 3 |
| 99 | 3 |
| 100 | 3 |
| 101 | 3 |
| 102 | 3 |
| 103 | 2 |
| 104 | 2 |
| 105 | 2 |
| 106 | 2 |
| 107 | 2 |
| 108 | 2 |
| 109 | 2 |
| 110 | 2 |
| 111 | 2 |
| 112 | 1 |
| 113 | 1 |
| 114 | 1 |
| 115 | 1 |
| 116 | 1 |
| 117 | 1 |
| 118 | 1 |
| 119 | 1 |
| 120 | 1 |
| 121 | 1 |
| 122 | 1 |
| 123 | 1 |
| 124 | 1 |
| 125 | 1 |
| 126 | 1 |
| 127 | 1 |
<< YM2413 Reverse Engineering Notes 2015-03-20 | YM2413 Reverse Engineering Notes | YM2413 Reverse Engineering Notes 2015-04-09 >>
