|
|
DevelopmentSega Master System / Mark III / Game Gear |
Home - Forums - Games - Scans - Maps - Cheats - Credits |
YM 2413 Reverse Engineering Notes 2015 - 12 - 03
by andete. Original documents available at: https://github.com/andete/ym2413/tree/master/results
<< YM2413 Reverse Engineering Notes 2015-12-01 | YM2413 Reverse Engineering Notes | YM2413 Reverse Engineering Notes 2015-12-12 >>
Introduction
The YM2413 contains 18 operators. 2 operators combined form 1 channel, so the YM2413 has 9 melodic channels. Alternatively 6 of the operators can be used to produce 5 rhythm sounds, resulting in 6 melodic channels plus 5 rhythm channels.
So far all the reverse engineering was focused on a single operator. In this post I'll finally combine 2 operators into 1 melodic channel.
The YM2413 datasheet contains the following diagram:
   +-------------------+     +-------------------+
   |           +-----+ |     |           +-----+ |
   |    ------>| SIN |---------->(+)---->| SIN |----> F(t)
   |    |      +-----+ |     |    ^      +-----+ |
   |    |         ^    |     |    |         ^    |
   |    |         | I  |     |    |         | A  |
   | +-----+   +-----+ |     | +-----+   +-----+ |
   | | PG  |   | EG  | |     | | PG  |   | EG  | |
   | +-----+   +-----+ |     | +-----+   +-----+ |
   +-------------------+     +-------------------+
F(t) = A sin(wc * t + I * sin(wm * t))
with
- A = amplitude
- I = modulation index
- wc = ~ carrier frequency (omega-c)
- wm = ~ modulator frequency (omega-m)
and
- SIN: sine lookup table (with phase and amplitude inputs)
- PG: phase generator (includes FM modulator)
- EG: envelope generator (includes attack-decay-sustain-release, but also amplitude modulator)
Each of the 2 big squares is 1 operator. By chaining them together in this configuration (the only possible configuration for YM2413; Y8950 and YMF262 also have other configurations) the output of the 1st operator (called the 'modulator', or 'mod') can modulate the phase of the 2nd operator (called the 'carrier' or 'car').
So this configuration implements phase modulation. Mathematically phase modulation and frequency modulation are closely related. So often this configuration is also called frequency modulation. Note that this is a different form of frequency modulation as what was discussed in the previous post (that was FM within 1 operator, here it's 2 operators combined that produce FM).
From all the information in the previous posts we already have a fairly good idea how a single operator works. The new part here is chaining them together. In the diagram this chain in drawn as a simple line. In reality it's a bit more complex. E.g. is the output of the modulator still multiplied with some factor before being added to the phase of the carrier? How many bits does this signal have? Is the addition done before or after the 10.9 bits fixed-point phase counter is truncated to an integer?
Measurements
I captured waveforms using the following settings:
| Operator | AM | PM | EG | KR | ML | KL | TL | WF | FB | AR | DR | SL | RR |
|---|---|---|---|---|---|---|---|---|---|---|---|---|---|
| modulator | 0 | 0 | 1 | 0 | 00 | 0 | nn | 0 | 0 | 15 | 00 | 00 | 15 |
| carrier | 0 | 0 | 1 | 0 | 00 | 0 | 0 | 15 | 00 | 00 | 15 |
| reg#0x20 = 0x00 | key-off |
| reg#0x10 = 0x40 | fnum-low=0x40 |
| reg#0x30 = 0x00 | max volume / custom instrument |
| reg#0x20 = 0x10 | key-on / block=0 |
with TL varied between 0..63
Note: for TL=63 this gives the (almost) sine wave I've been using in most of my previous posts. For lower values of TL the modulator operator gets less attenuated and thus there's more modulation.
I'm using a very low frequency: 16384 samples for 1 period (~3Hz). So each of the 1024 entries in the sine table is repeated 16 times.
The results are presented in a table (I suggest to look at these images from back to front, 63 to 0):
| +0 | +1 | +2 | +3 | |
|---|---|---|---|---|
| 0 |  |  |  | 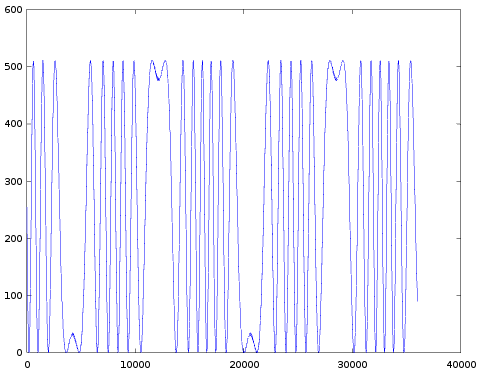 |
| 4 |  |  |  |  |
| 8 |  |  |  |  |
| 12 |  | 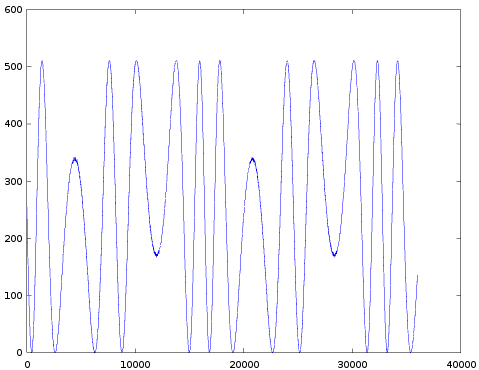 |  |  |
| 16 |  | 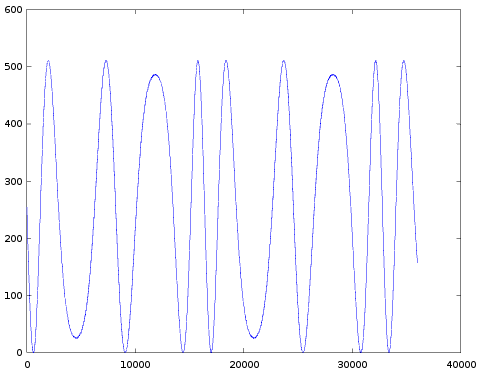 |  |  |
| 20 |  |  |  |  |
| 24 |  |  |  |  |
| 28 |  |  | 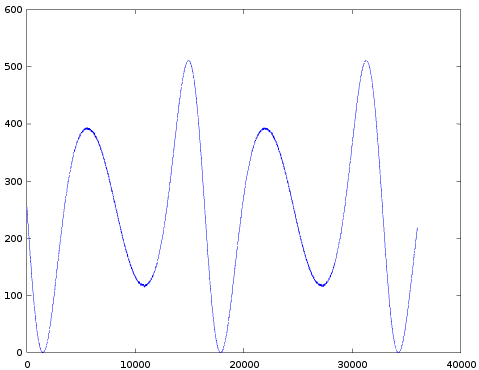 |  |
| 32 |  |  |  | 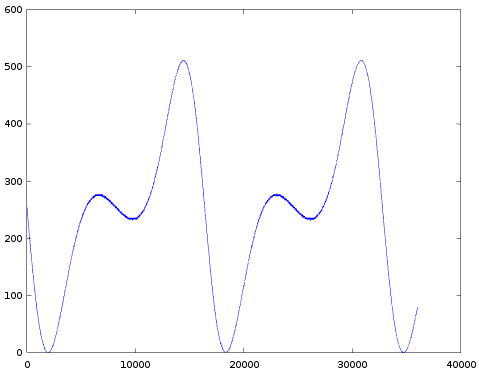 |
| 36 | 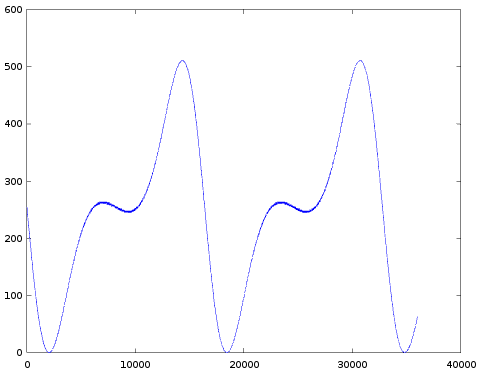 |  | 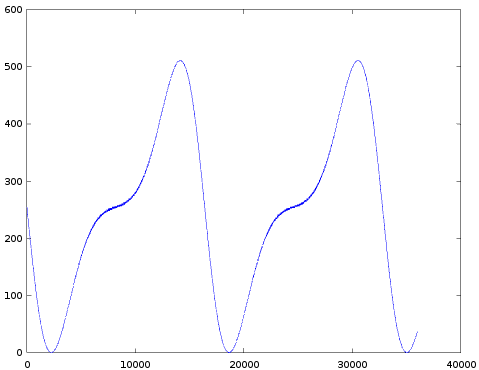 |  |
| 40 |  |  |  |  |
| 44 |  |  |  |  |
| 48 |  |  |  |  |
| 52 |  |  |  | 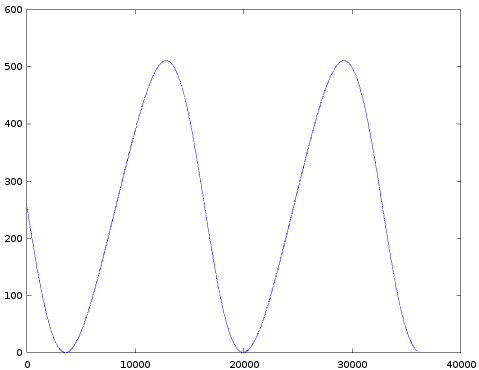 |
| 56 |  |  |  |  |
| 60 |  |  |  |  |
Some observations:
- Completely as expected, the amount of modulation indeed increases with decreasing TL.
- All images appear to be upside down: normally you expect a sine wave to first go up and then down. In all these images it's the other way around. I did start each graph right after the 'key-on' event (more on this below), so there isn't simply a 180 degrees phase shift. One explanation is that the sine-table in the YM2413 really is like this. But a much more likely explanation is that in the whole test setup the sign of the audio signal is somehow flipped. But this doesn't matter at all.
- Each time the same note is played, the wave looks exactly the same. This suggests the phases of both operators are somehow synchronized. Possibly both phase-counters are reset to zero at the start of the attack phase.
- The frequency of both operators was chosen so that they both produce the same value for 16 consecutive samples. Though when we zoom in we see this:


(These graphs are for TL=8, but similar features can be seen for all other TL values). Instead of seeing the same value for 16 consecutive samples we only see 15 samples with the same value, followed by 1 other value again followed by 15 constant samples. This could be explained by assuming the modulator and carrier are 1 step out of phase.
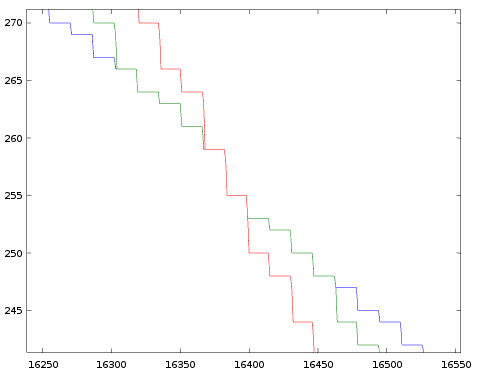
- The next image combines 3 of the graphs from the table into 1 image (for TL=32, 48 and 63).

In all these measurements both the modulator and the carrier have the same frequency, we also believe they are both (almost) in phase. So that means every half-period both operators internal sine-wave has a zero crossing. So the output of the total channel should also be zero. We can indeed see this in the combined image: every 8192 samples all graphs cross zero. (Remember values 255 and 256 on the y-axis represent YM2413 values +0 and -0.)
If we zoom in near the green and red box we respectively get:

This shows that every half period, the waveforms for all TL-values indeed exactly overlap (the image only shows 3 graphs, but this property holds for all TL values).
- It's also interesting to see what happens immediately before (i.e. to the left of) all these graphs, that is before key-on was set. The next image shows a zoomed version of that situation.
Inside the red circle you see a spike. I started all the graphs in the big table at the sample immediately right from this spike.
At the left of this graph, the waveform of the previous measurement is visible. Near the start of the green line the YM2413 registers are re-programmed, we very briefly set key-off followed by key-on again. This triggers the 'damp' phase, that is instead of immediately going to the attack phase, the envelope generator first (at a fairly fast pace) drops to maximum attenuation, only when that point is reached we enter the attack phase (I think this is different from the other OPLx chips. I need to investigate this is in more detail later). The whole 'damp' phase is indicated by the green line.
On the right is the red circle. There are 2 interesting features in this circle:
- The spike I already mentioned. In all these measurement I saw such a spike. The width is always a single sample, but the height varies from measurement to measurement. I used these spikes to sync all graphs on. I have no idea yet what causes these spikes, but it might be related to the off-by-1 synchronization between mod and car.
- Immediately right from the spike the attack phase starts. I've chosen AR=15 for my measurements, that should result in an infinitely fast attack rate, though the signal does start slower (i.e. with lower amplitude) than expected. At least when you compare with the values from the later periods (16384 samples further). Maybe AR=15 is not infinitely fast?
- It's interesting to look at the graph for TL=37 in more detail. Halfway each period there's a region where the graph appears 'flat'. The next image zooms in on that region:
As you can see the actual signal is not flat at all, it oscillates between 2 values with spikes to a 3rd value. More on this below.
Model the observed behavior.
The next step is to try to reproduce the measured values with a model of the system. But let me first repeat the model we had so far for a single operator:
uint16_t expTable[256];
void initTables() {
for (int i = 0; i < 256; ++i) {
logsinTable[i] = round(-log2(sin((double(i) + 0.5) * M_PI / 256.0 / 2.0)) * 256.0);
expTable[i] = round((exp2(double(i) / 256.0) - 1.0) * 1024.0);
}
}
uint16_t lookupSin(uint16_t val) {
bool sign = val & 512;
bool mirror = val & 256;
val &= 255;
auto result = logsinTable[mirror ? val ^ 0xFF : val];
if (sign) result |= 0x8000;
return result;
}
int16_t lookupExp(uint16_t val) {
bool sign = val & 0x8000;
int t = (expTable[(val & 0xFF) ^ 0xFF] << 1) | 0x0800;
int result = t >> ((val & 0x7F00) >> 8);
if (sign) result = ~result;
return result >> 4;
}
int main() {
initTables();
int vol = 0; // 0..15
int env = 0; // 0..127
int am = 0; // 0..13
for (int i = 0; i < 1024; ++i) {
auto s = lookupSin(i);
cout << lookupExp(s + 128 * vol + 16 * env + 16 * am) + 256 << endl;
}
}
To extend this model to a 2-operator channel, the main loop needs to have the following form:
for (int i = 0; i < 1024; ++i) {
auto s1 = lookupSin(i);
auto m = lookupExp(s + <unknown1> * TL); // TODO multiplication factor
auto s2 = lookupSin(i + <unknown2> * m); // TODO shift 'm'?
cout << lookupExp(s2 + 128 * vol + 16 * env + 16 * am) + 256 << endl;
}
Note that the implementation of lookupExp() drops the lowest 4 bits from the value found in the exponent-lookup-table. Immediately after we multiply that value by 16. So maybe these bits didn't need to be dropped in the first place? Remember, in an earlier post I showed the die shots of the YM2413 and YMF262 ROM tables, and they were quasi identical, suggesting the YM2413 and YMF262 use the same exponent ROM table. In that post I also said I found it strange that in our YM2413 model we drop the lowest 4 bits of exponent table (why include the bits in the table if they are not used). So maybe here, in the mod-car calculation, all the bits of this table are being used?
Further experiments show that for non-zero values of TL, the model matches (the overall shape of) the measurements for 'unknown1' equal to 32. I've also changed the model to produce 16 consecutive samples with a constant value (same as in the measurements). With all these changes the model becomes:
bool sign = val & 0x8000;
int t = (expTable[(val & 0xFF) ^ 0xFF] << 1) | 0x0800;
int result = t >> ((val & 0x7F00) >> 8);
if (sign) result = ~result;
return result; // do not drop lower 4 bits
}
...
int TL = 0; // modulation index 0..63
for (int i = 0; i < 1024 * 16; ++i) {
auto s1 = lookupSin(i / 16);
auto m = lookupExp2(s + 32 * TL);
auto s2 = lookupSin(i / 16 + m);
cout << lookupExp(s2 + 128 * vol + 16 * env + 16 * am) + 256 << endl;
}

Earlier I already guessed the mod and car operators are 1 sample out of phase. Let's test this hypothesis by tweaking the model:
auto s1 = lookupSin((i - 1) / 16); // mod is 1 sample behind car
auto m = lookupExp2(s + 32 * TL);
auto s2 = lookupSin(i / 16 + m);
cout << lookupExp(s2 + 128 * vol + 16 * env + 16 * am) + 256 << endl;
}

So this can reproduce the spikes, but the other oscillations are still missing. It took some time, but then I got the idea to reduce the resolution of the expTable again (drop 1 bit instead of 4). This can be modeled like this:
auto s1 = lookupSin((i - 1) / 16);
auto m = lookupExp2(s + 32 * TL) & ~1; // mask lowest bit
auto s2 = lookupSin(i / 16 + m);
cout << lookupExp(s2 + 128 * vol + 16 * env + 16 * am) + 256 << endl;
}

With this last change the graph matches exactly with the measured data, not only for TL=37, but for all values!
Actually, it's not a 100% match for the following two reasons:
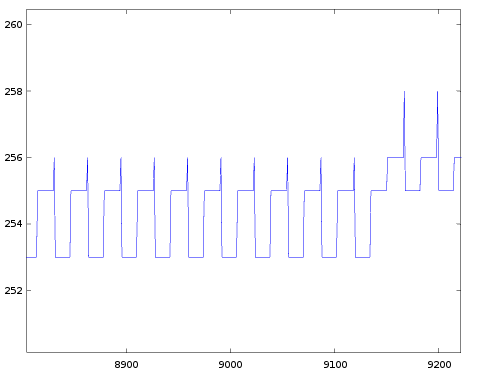
- Measurement noise: when I overlay a measured with a generated graph you sometimes see small spikes in the measured version. These only occur near the extremes (top and bottom y-values) and from previous posts we know there is considerably more measurement noise in those regions. When measuring the same data again, these spikes disappear or move to different positions. That's another indication it's just noise. The following image shows this. The blue curve is the measured data, the green curve is the generated data. Both curves almost fully overlap except for a few spikes (so mostly only the green curve is visible).

- At the very start of the signal there's still a small discrepancy. This is the transition stuff I talked about above (infinitely fast attack rate or not). I need to investigate this further (later).

Next steps
In the experiments in the previous posts I often got the problem that the prediction didn't match exactly with the measured data because I ignored the modulator operator in the predictions. Now we know exactly how this works, so we could revisit those experiments.
Another thing we didn't look at yet is the 'feedback' mechanism: the output of the modulator operator can be feed-back to the input of the same operator (to modulate itself).
<< YM2413 Reverse Engineering Notes 2015-12-01 | YM2413 Reverse Engineering Notes | YM2413 Reverse Engineering Notes 2015-12-12 >>
